Generali in Figures
04 October 2021
Historical Archive Generali
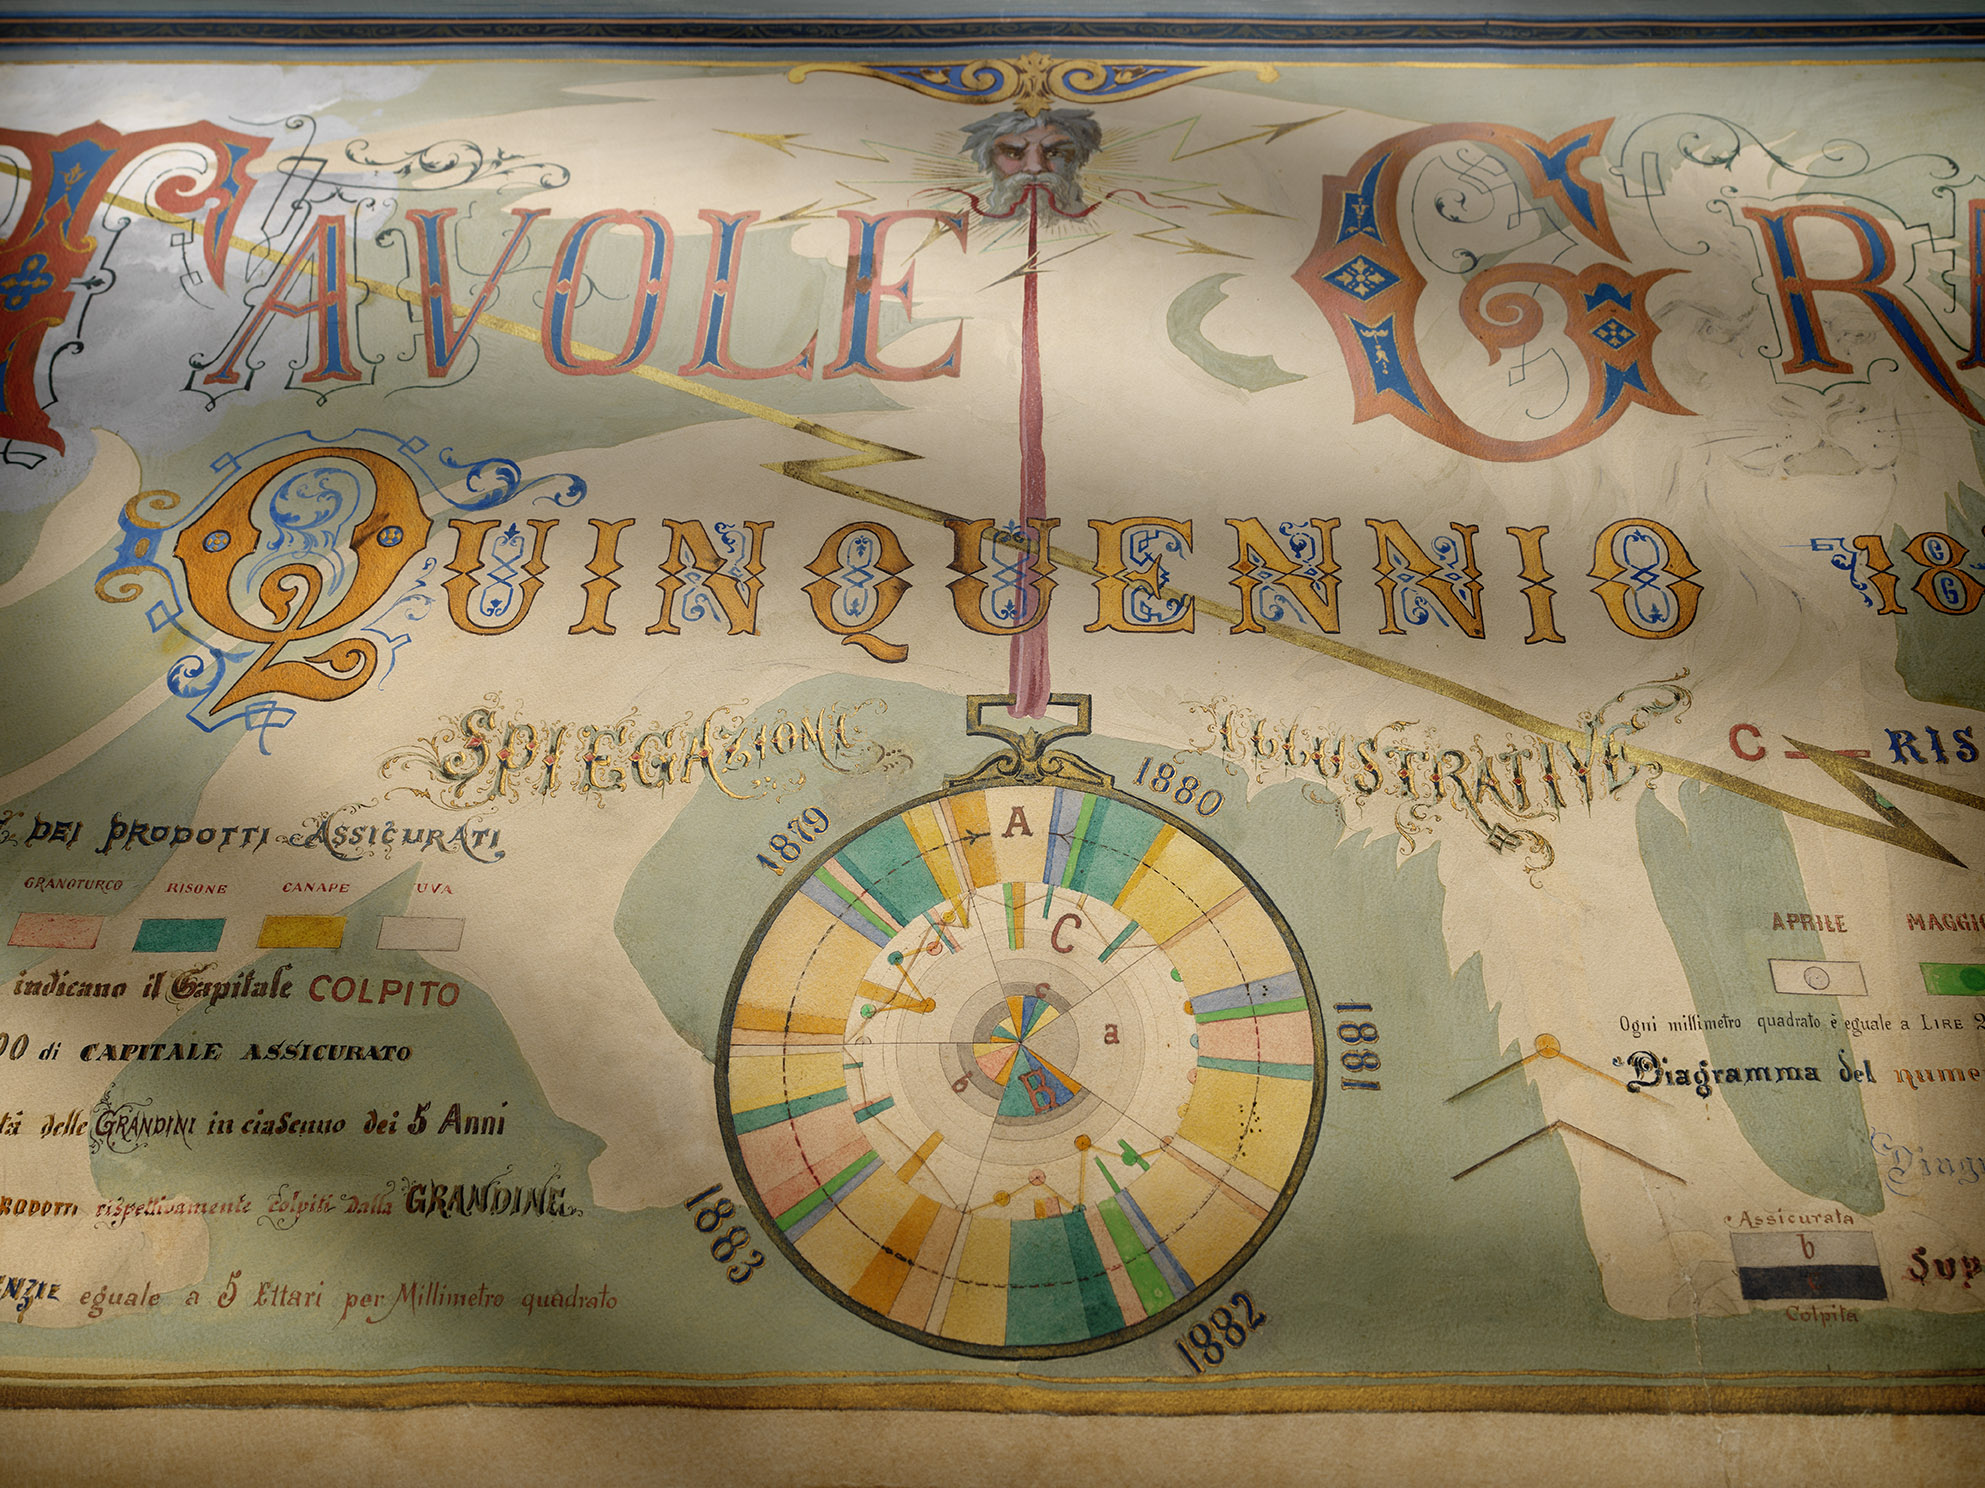
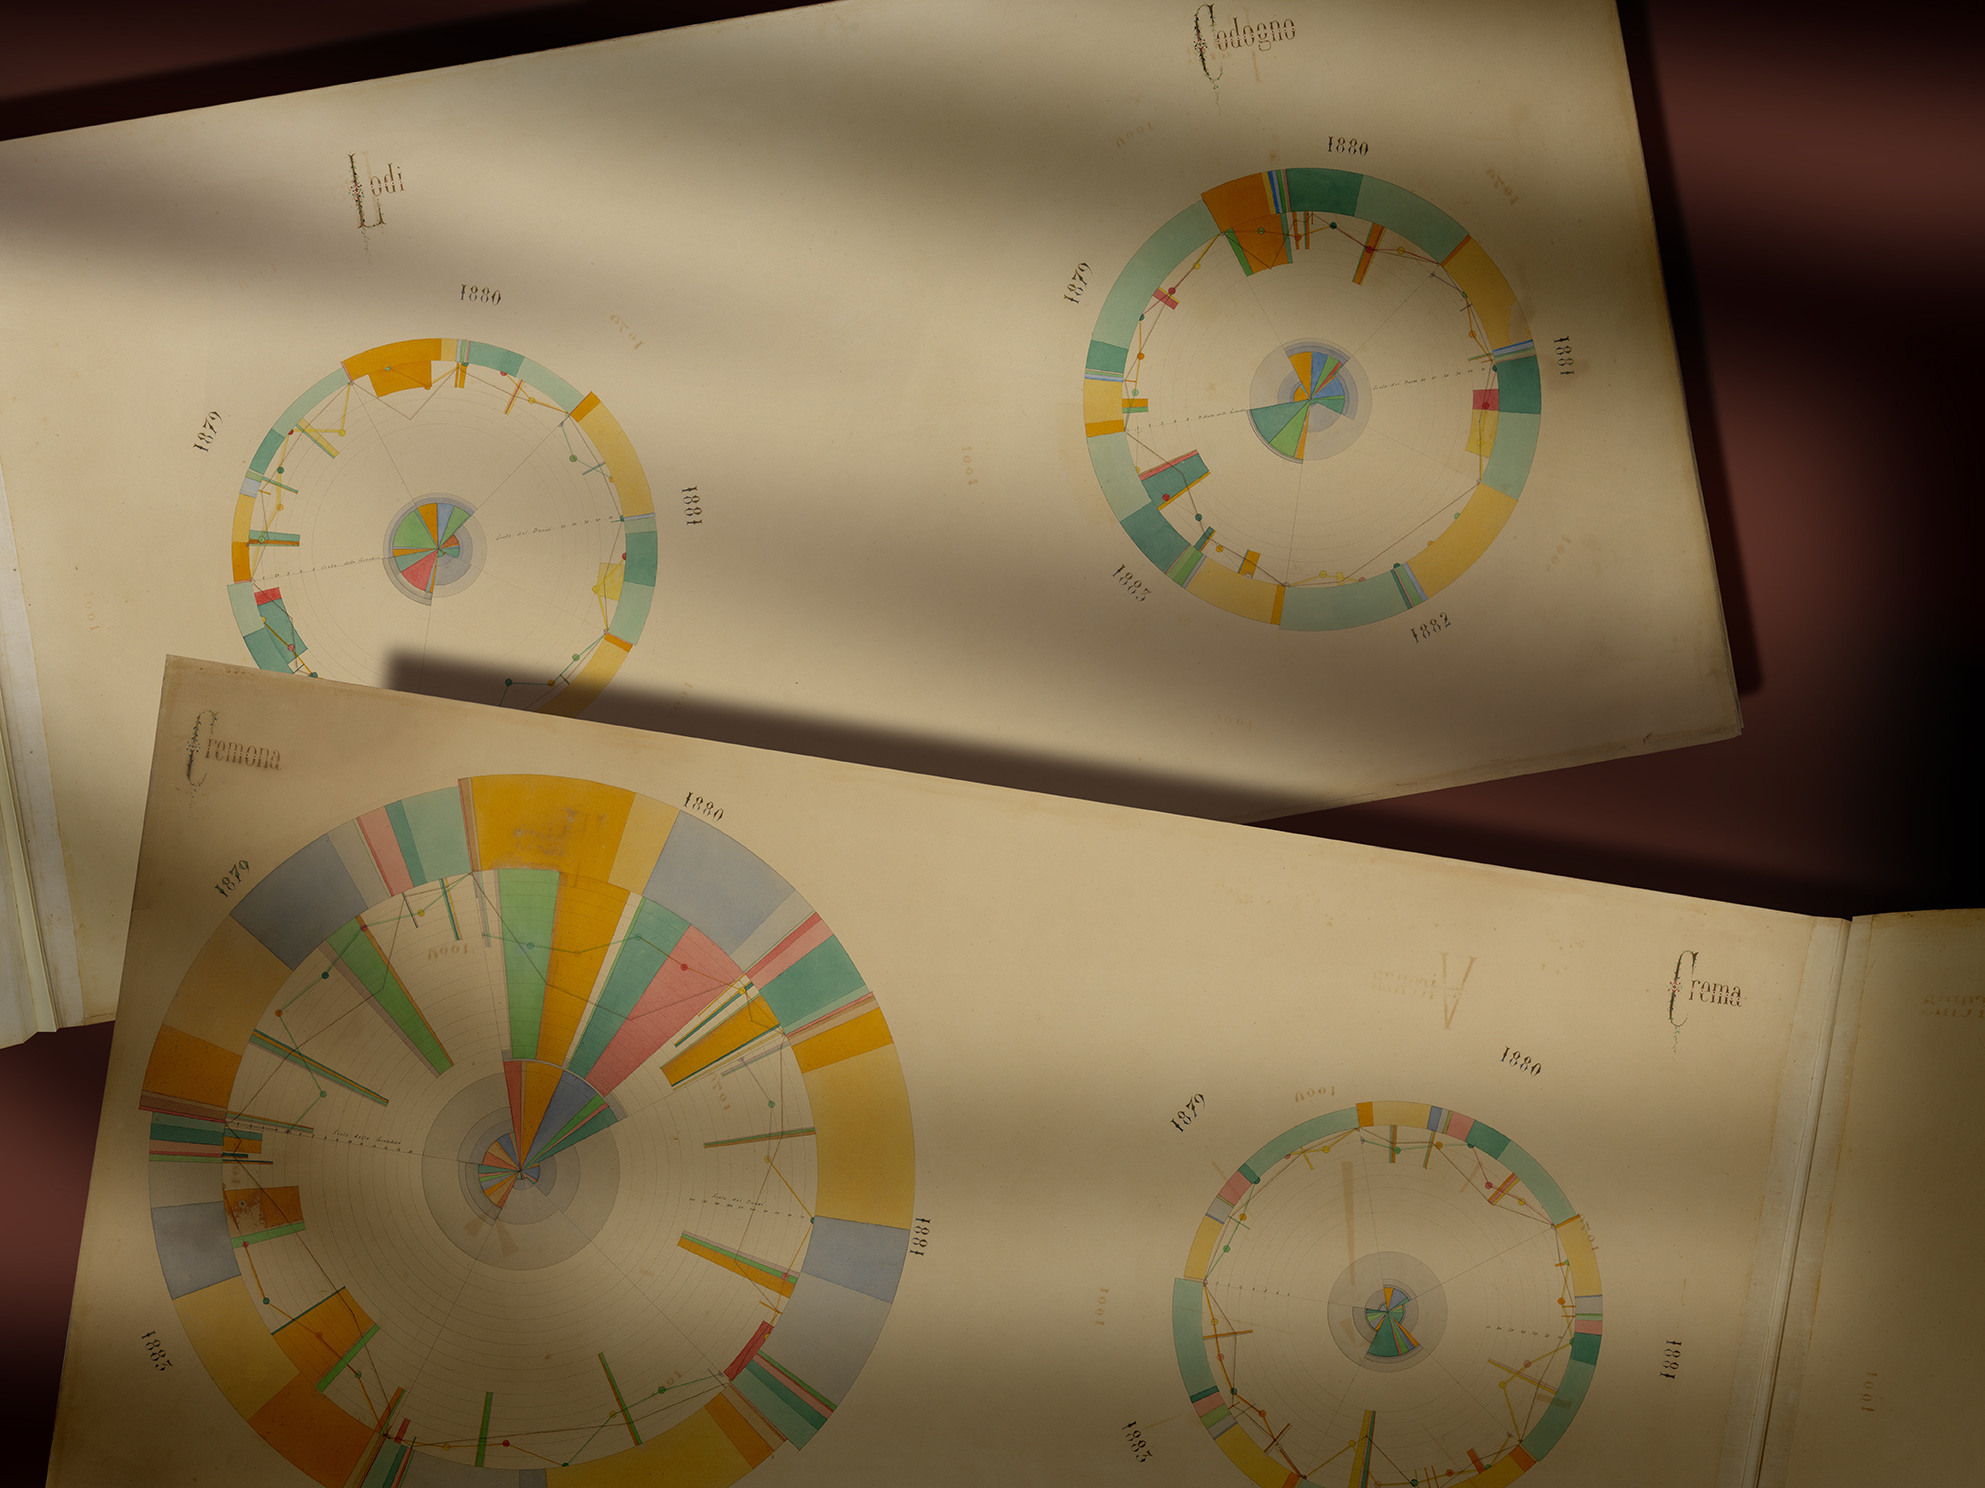
Generali in figures or the infographic of yesteryear: how to recount insurance work in concrete terms? For the Italian General Exposition of Turin in 1884, Generali decided to prepare precious large format (70 x 130 cm) watercolour plates with pie charts to highlight the precipitation of hail in the Italian peninsula from 1879 to 1883.
The complex diagrams take into account the type and value of the insured product, the intensity of hail and the amount of compensation paid by Assicurazioni Generali in the territory of 74 agencies, from Novara to Turin and Milan, then down to Bologna, Rome, Benevento and Potenza, to name a few.
Probably placed on stands during the exposition, the plates were then bound in a large album, which was completely restored in 2015. They represent a key element for reconstructing the history of hail insurance, a difficult branch in which Generali decided to operate, innovating it twofold, with both robust data collection, also promoted independently, and through subsidiaries operating in different European countries.
Decorated and well-illustrated charts represent a constant in recounting insurance and the Generali Archive preserves many historical examples, from end of the nineteenth-early twentieth century Memoires published on the occasion of participation in universal expositions to balance sheets, from hand-made albums realised on the occasion of Generali anniversaries or those of its officials to advertising brochures.


